(Updated in May 2021 using the latest test data from Spring 2019 NJSLA Assessment Reports)
What is the best school in Jersey City? We understand that parents, teachers, and administrators may have strong feelings about standardized tests and the ratings and rankings that utilize these results in their methodologies, but testing does provide us with a rich data set to begin to answer the question.
Public schools in New Jersey administer standardized tests from the PARCC and the shortened version, NJSLA to which the state has transitioned. The assessments define 5 levels of performance as follows:
- Level 5 – Exceeded Expectations
- Level 4 – Met Expectations
- Level 3 – Approached Expectations
- Level 2 – Partially Met Expectations
- Level 1 – Did Not Yet Meet Expectations
We have collected test data of local schools and provide a few charts below. These charts are best viewed on a desktop computer, so if you are reading this on mobile, send yourself this link and open it again from a desktop for best viewing results.
To begin, we first need to define the scope of our review, which tries to include all public schools available to Jersey City residents. School categories represented in this analysis include Jersey City Public and Charter Schools.
If you are evaluating schools for your child in grades Pre-K through 5, you would want to consider both Elementary Schools and Grammar Schools. The two charts below show data on 5th Graders test scores in Math and ELA (English and Language Arts), and as a result, allows you to compare Elementary and Grammar Schools on an equal footing by focusing on each school’s testing outcomes among its 5th grade students. These charts display the mean of the school’s standardized test scores for Grade 5, as well as the percentage of students performing at each level of achievement. Click each chart from a desktop computer for a better resolution Tableau chart.


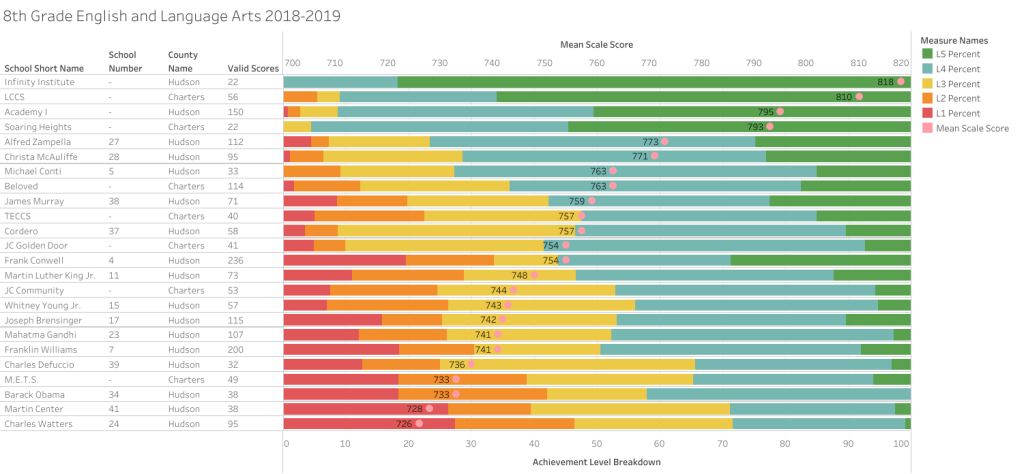
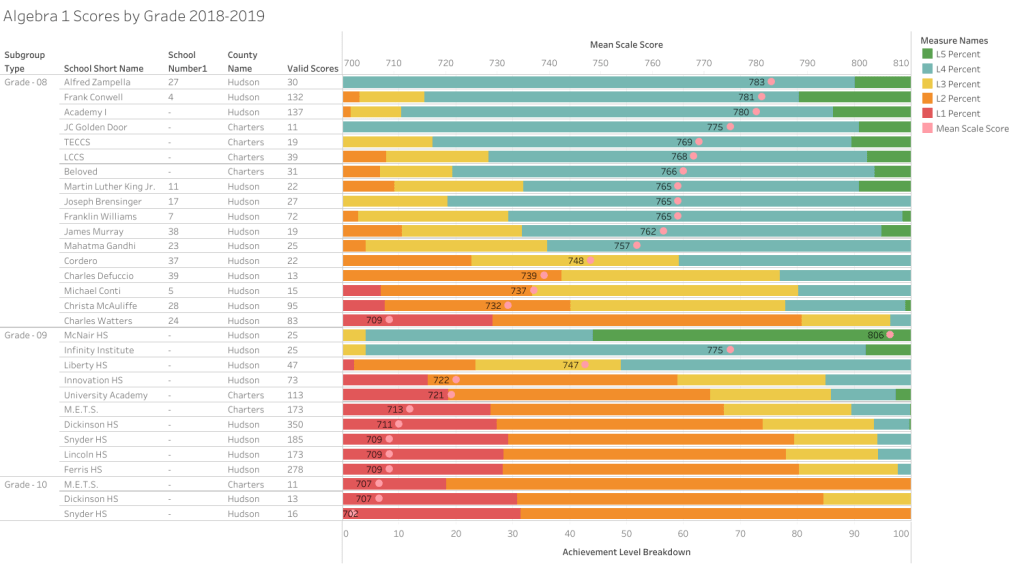
Looking now at middle schools, we investigate the results of 8th Grade Math and 8th Grade ELA (English and Language Arts), as well as the results of Algebra I. These charts require some additional interpretation. The magnet programs, Infinity Institute and the AEP Program, which is held at two locations, Academy I and MS 4, have many students accelerated into Algebra I by 8th grade, so you will notice these schools near the top of the list when looking at Algebra I test results.

Finally, to evaluate high schools, we find the following chart to be most compelling. It compares the results of Algebra II assessments, taken by 9th and 10th grade students, and as a result has a much smaller number of schools listed.

Check here for older data from the 2018 PARCC tests.
Check here for older data from the 2017 PARCC tests.
