This page has test score data from 2017. Looking for the most up to date information? Check our PARCC Score Reports page.
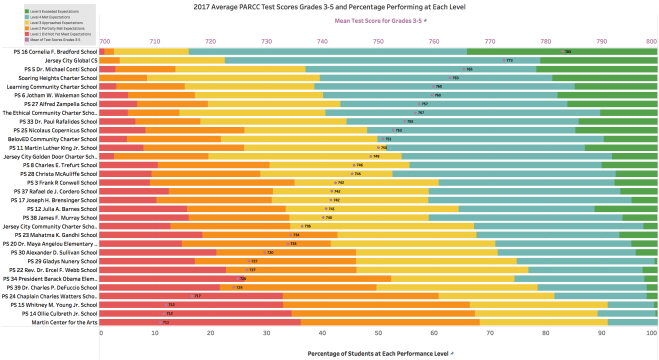
If you are evaluating schools for your child in grades Pre-K through 5, you would want to consider both Elementary Schools and Grammar Schools. The chart below shows data on test scores from Grades 3-5, and as a result, allows you to compare Elementary and Grammar Schools on an equal footing by focusing on the grades and PARCC tests in common. The chart displays the mean of the school’s standardized test scores for grades 3-5, as well as the percentage of students performing at each level in those grades. Click each chart from a desktop computer for better resolution.
If you are instead evaluating schools for your child in grades 6-8, you would want to consider Grammar Schools, Middle Schools, and Middle/High Schools. The chart below shows data on test scores from Grades 6-8, excluding test scores of 8th graders taking the Algebra 1 PARCC test, and as a result, allows you to compare all eligible schools on an equal footing by focusing on the grades and PARCC tests in common.

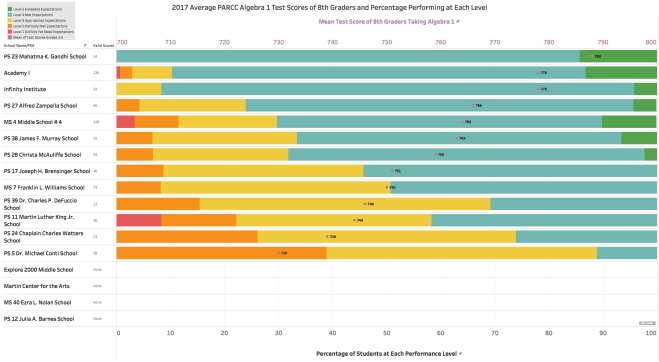
Separately, we hone in on 8th graders taking the Algebra 1 PARCC test. In this chart, the number of Valid Scores gives you an indication of how many students from each school sat for the Algebra 1 PARCC test. The state likely did not report any data for some schools because they did not have enough 8th graders take the Algebra 1 test. This chart is useful because it highlights the schools that have some students in an accelerated program, taking Algebra 1 in 8th grade, rather than in 9th grade as part of the regular curriculum.
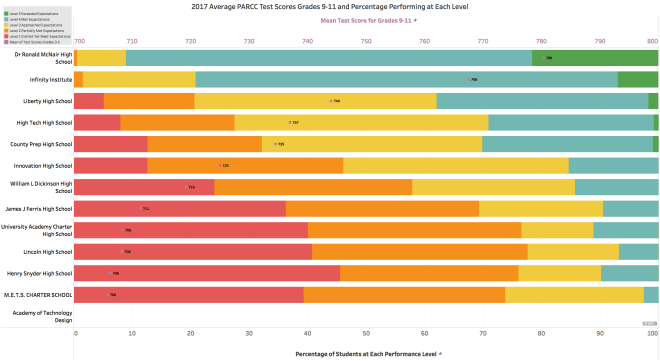
If you are evaluating high schools, you might want to review the test scores of only the high school students within a school. The chart below shows data on test scores from Grades 9-11, excluding, for example, test scores of 8th graders of the same school taking the Algebra 1 PARCC test.
The following chart attempts to summarize all 2017 PARCC test score data into a single data visualization to compare each school against its school type peers.

The data represents the average (mean) of the average scores (mean scores) of all PARCC tests for each school.
Because students of schools of different types take different tests, it would be inappropriate to draw definitive conclusions across School Types using this chart. Examples:
- Elementary school students take completely distinct tests from High School (HS) students, so direct comparisons of the figures for PS 16 with the figures for McNair would be inappropriate using this chart
- Grammar Schools include grades 6-8; whereas, Elementary Schools do not, so direct comparisons between Elementary Schools and Grammar Schools would be best made using the first chart above
- Infinity Institute is both a middle school and a high school, so direct comparisons between Infinity and McNair or between Infinity and Academy I would not be appropriate using this chart
Also note that we have reason to believe that the AEP program housed within MS 4 would score more comparably to Academy I (also an AEP program school) if it was evaluated in isolation. Following the same logic, we suspect that the remainder of MS 4 would score lower if evaluated in the absence of its AEP program. These conclusions are supported by the relatively high performance of 8th graders taking Algebra 1 at MS 4.
