(Updated for 2018 PARCC Test Data, November 2018)
What is the best school in Jersey City? We understand that parents, teachers, and administrators may have strong feelings about standardized tests, but testing does provide us with a rich data set to begin to answer the question.
Public schools in New Jersey administer standardized tests from the PARCC, which defines 5 levels of performance as follows:
- Level 5 – Exceeded Expectations
- Level 4 – Met Expectations
- Level 3 – Approached Expectations
- Level 2 – Partially Met Expectations
- Level 1 – Did Not Yet Meet Expectations
We have collected test data of local schools and provide a few charts below. These charts are best viewed on a desktop computer, so if you are reading this on mobile, send yourself this link and open it again from a desktop for best viewing results.
To begin, we first need to define the scope of our review, which tries to include all public schools available to Jersey City residents. School categories represented in this analysis include:
- Jersey City Public Schools
- Jersey City Charter Schools
- Hudson County Schools
The school types are defined as follows:
- Elementary: Pre-K through 5th grade
- Grammar: Pre-K through 8th grade
- MS: 6th through 8th grade
- MS/HS: 6th through 12th grade
- HS: 9th through 12th grade
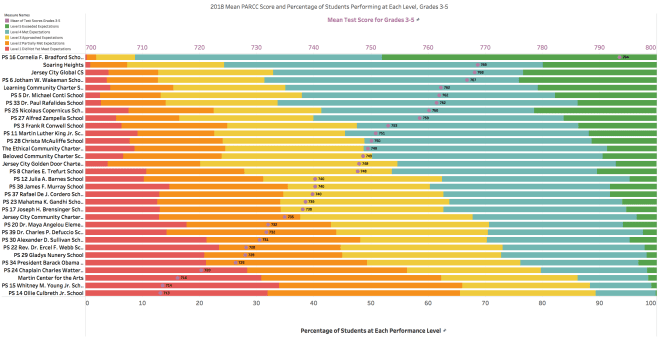
So if you are evaluating schools for your child in grades Pre-K through 5, you would want to consider both Elementary Schools and Grammar Schools. The chart below shows data son test scores from Grades 3-5, and as a result, allows you to compare Elementary and Grammar Schools on an equal footing by focusing on the grades and PARCC tests in common. The chart displays the mean of the school’s standardized test scores for grades 3-5, as well as the percentage of students performing at each level in those grades. Click each chart from a desktop computer for better resolution.
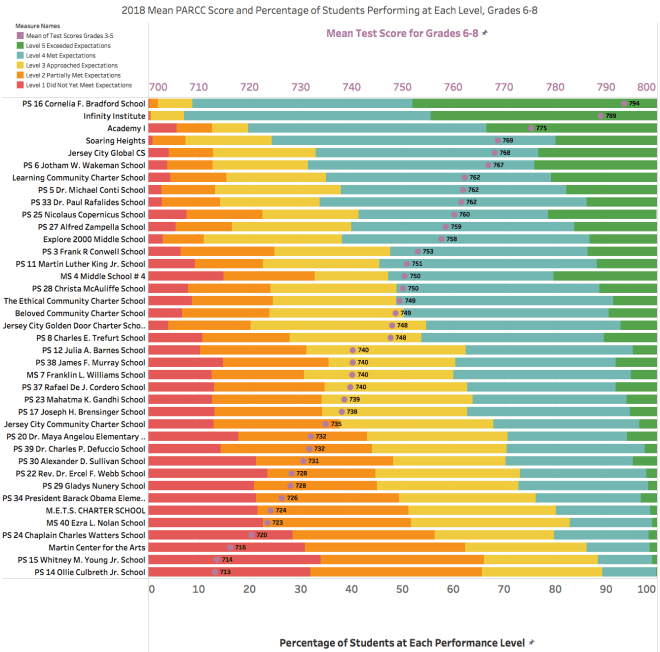
If you are instead evaluating schools for your child in grades 6-8, you would want to consider Grammar Schools, Middle Schools, and Middle/High Schools. The chart below shows data on test scores from Grades 6-8, excluding test scores of 8th graders taking the Algebra 1 PARCC test, and as a result, allows you to compare all eligible schools on an equal footing by focusing on the grades and PARCC tests in common.
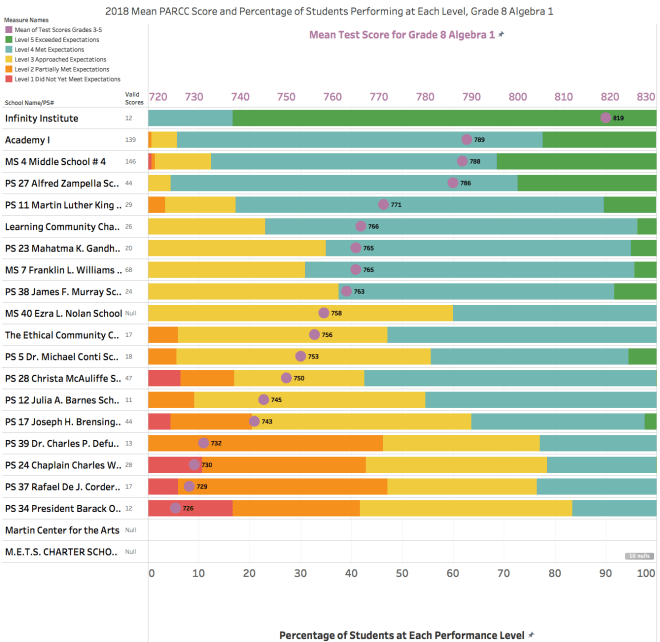
Separately, we hone in on 8th graders taking the Algebra 1 PARCC test. In this chart, the number of Valid Scores gives you an indication of how many students from each school sat for the Algebra 1 PARCC test. The state likely did not report any data for some schools because they did not have enough 8th graders take the Algebra 1 test. This chart is useful because it highlights the schools that have some students in an accelerated program, taking Algebra 1 in 8th grade, rather than in 9th grade as part of the regular curriculum.
If you are evaluating high schools, you might want to review the test scores of only the high school students within a school. The chart below shows data on test scores from Grades 9-11, excluding, for example, test scores of 8th graders of the same school taking the Algebra 1 PARCC test.

The following chart attempts to summarize all PARCC test score data into a single data visualization to compare each school against its school type peers.

The data represents the average (mean) of the average scores (mean scores) of all PARCC tests for each school.
Because students of schools of different types take different tests, it would be inappropriate to draw definitive conclusions across School Types using this chart. Examples:
- Elementary school students take completely distinct tests from High School (HS) students, so direct comparisons of the figures for PS 16 with the figures for McNair would be inappropriate using this chart
- Grammar Schools include grades 6-8; whereas, Elementary Schools do not, so direct comparisons between Elementary Schools and Grammar Schools would be best made using the first chart above
- Infinity Institute is both a middle school and a high school, so direct comparisons between Infinity and McNair or between Infinity and Academy I would not be appropriate using this chart
Also note that we have reason to believe that the AEP program housed within MS 4 would score more comparably to Academy I (also an AEP program school) if it was evaluated in isolation. Following the same logic, we suspect that the remainder of MS 4 would score lower if evaluated in the absence of its AEP program. These conclusions are supported by the relatively high performance of 8th graders taking Algebra 1 at MS 4.
Check here for older data from the 2017 PARCC tests.
